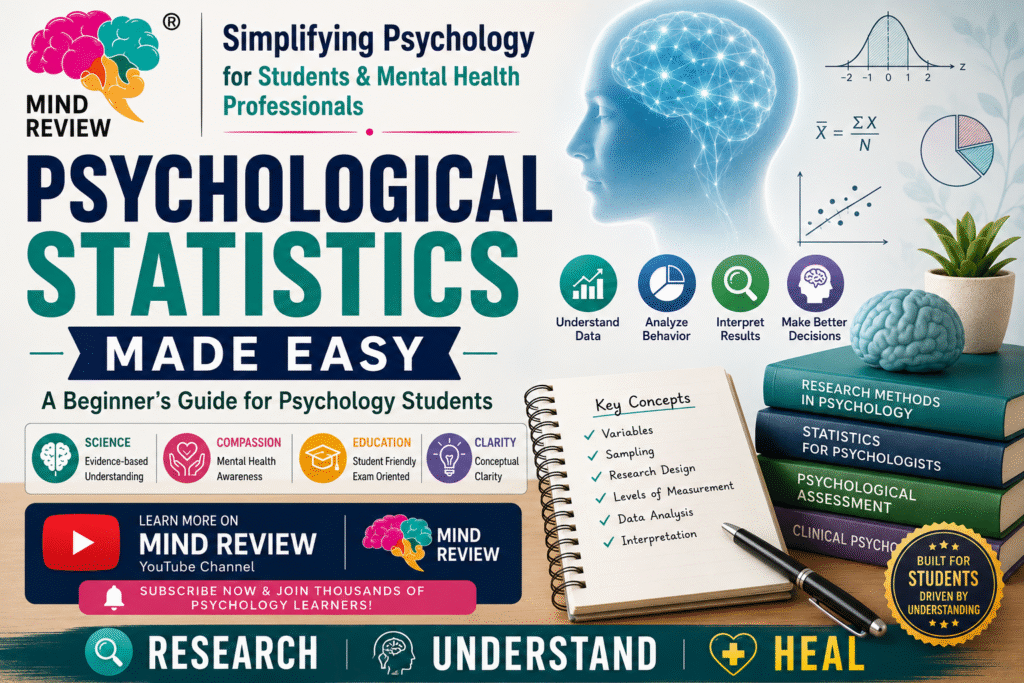
Hi friends, Have you ever felt nervous when you hear the word statistics? If you’re a psychology student, you’re definitely not alone. Many students assume statistics is all about complicated formulas, endless calculations, and advanced mathematics. The reality, however, is quite different.
Statistics is not merely about numbers—it is the language of psychological research. Every scientific conclusion in psychology, whether related to depression, intelligence, memory, personality, or behavior, relies on statistical methods to ensure that findings are accurate, reliable, and meaningful.
In this blog, we will break down the fundamental concepts of psychological statistics in a simple and practical way, helping you build a strong foundation for your academic journey.
If you wish to understand this through a video then go to Mind Review
Table of Contents
- Why is Statistics Important in Psychology?
- Understanding Variables: The Building Blocks of Research
- Qualitative vs Quantitative Variables
- Discrete vs Continuous Variables
- The Four Levels of Measurement
- Nominal Scale
- Ordinal Scale
- Interval Scale
- Ratio Scale
- Population and Sample: Who Do We Study?
- Sampling Methods Every Psychology Student Should Know
- Simple Random Sampling
- Stratified Sampling
- Convenience Sampling
- Understanding Research Designs
- Experimental Design
- Quasi-Experimental Design
- Non-Experimental Design
- Don’t Fear Sigma (Σ): Introduction to Summation Notation
- Common Mistakes Psychology Students Make
- Final Thoughts
- Continue Learning with Mind Review
💡 Prefer learning through videos?
This blog is based on concepts that I regularly teach on my YouTube channel, Mind Review, where I simplify psychology, research methods, statistics, psychological assessments, and mental health topics for students and professionals. If you enjoy learning through visual explanations, practical examples, and exam-oriented discussions, make sure to subscribe to Mind Review and continue your learning journey beyond this blog.
Why is Statistics Important in Psychology?
Psychology is a science that seeks to understand human thoughts, emotions, and behavior. To study these complex phenomena objectively, psychologists collect and analyze data.
Statistics helps researchers:
- Convert raw observations into meaningful information.
- Draw conclusions based on evidence rather than personal opinions.
- Identify patterns and relationships in behavior.
- Communicate research findings clearly and scientifically.
- Make informed decisions in clinical, educational, organizational, and research settings.
Without statistics, psychology would remain a collection of subjective observations rather than a scientific discipline.
Understanding Variables: The Building Blocks of Research
Every psychological study revolves around variables—characteristics that can change or vary from one individual or situation to another.
Independent Variable (IV)
The Independent Variable is the factor that a researcher manipulates or controls.
Example:
A researcher wants to examine whether a new antidepressant reduces symptoms of depression.
- Type of antidepressant = Independent Variable
Dependent Variable (DV)
The Dependent Variable is the outcome being measured.
Example:
- Reduction in depression symptoms = Dependent Variable
Simply put, the independent variable influences, while the dependent variable reflects the effect.
Qualitative vs Quantitative Variables
Variables can be classified based on the type of information they represent.
Qualitative Variables
These describe qualities or categories rather than numerical values.
Examples:
- Gender
- Blood group
- Hair color
- Marital status
Quantitative Variables
These can be expressed numerically and measured.
Examples:
- Age
- Height
- Weight
- Test scores
Quantitative variables allow researchers to perform mathematical and statistical analyses.
Discrete vs Continuous Variables
Not all numerical variables behave the same way.
Discrete Variables
Discrete variables can only take specific whole-number values.
Examples:
- Number of children in a family
- Number of therapy sessions attended
- Number of hospital admissions
You cannot have 2.5 children or 3.7 therapy sessions.
Continuous Variables
Continuous variables can take any value within a range, including decimals.
Examples:
- Height
- Weight
- Reaction time
- Duration of sleep
These variables can be measured with increasing levels of precision.
The Four Levels of Measurement
One of the most important topics in statistics is understanding how variables are measured. Psychologists use four levels of measurement.
- Nominal Scale
The Nominal Scale simply categorizes or labels data.
Examples:
- Male / Female
- Right-handed / Left-handed
- Blood groups
There is no ranking or numerical meaning attached to these categories.
- Ordinal Scale
The Ordinal Scale arranges data in a meaningful order or ranking.
Examples:
- First, Second, Third position
- Mild, Moderate, Severe anxiety
- Satisfaction ratings
Although the order matters, the exact distance between categories is unknown.
- Interval Scale
The Interval Scale has equal intervals between values but lacks a true zero point.
Example:
- Temperature measured in Celsius or Fahrenheit
The difference between 20°C and 30°C is the same as the difference between 30°C and 40°C. However, 0°C does not mean the complete absence of temperature.
- Ratio Scale
The Ratio Scale contains all the characteristics of an interval scale and additionally includes a true zero.
Examples:
- Height
- Weight
- Income
- Number of errors made
A score of zero indicates the complete absence of the quantity being measured.
A Psychological Perspective
Pure ratio scales are relatively uncommon in psychology because many psychological characteristics—such as intelligence, anxiety, motivation, self-esteem, or aggression—rarely have a meaningful absolute zero.
🎥 Video Learning Tip
Many psychology students find scales of measurement confusing when they first encounter them. If you’re someone who learns better through visual examples and real-life applications, explore the educational content on Mind Review, where complex psychology concepts are explained in a simple, engaging, and exam-oriented manner.
Population and Sample: Who Do We Study?
Ideally, psychologists would like to study every individual in a population. However, this is often impossible due to limitations of time, money, and resources.
Population
The entire group of individuals a researcher wishes to understand.
Example:
All undergraduate psychology students in India.
Sample
A smaller group selected from the population for study.
Example:
300 psychology students from selected universities.
The quality of research depends heavily on how representative the sample is of the population.
Sampling Methods Every Psychology Student Should Know
Simple Random Sampling
Every individual in the population has an equal and independent chance of being selected.
Advantage: Minimizes selection bias and improves representativeness.
Stratified Sampling
The population is divided into subgroups (strata), and participants are selected from each group.
Example:
Selecting equal numbers of males and females from a university population.
Advantage: Ensures adequate representation of important subgroups.
Convenience Sampling
Participants are selected because they are easily accessible.
Example:
Recruiting students from one’s own college.
Advantage: Quick and cost-effective.
Limitation: Findings may not generalize well to the larger population.
Quick Revision Strategy
One effective way to remember sampling methods is to compare them side-by-side using practical examples. If you’re preparing for psychology examinations or entrance tests, check out the revision-friendly psychology content on Mind Review, where difficult concepts are broken down into easy-to-understand lessons.
Understanding Research Designs
The type of research design used determines the conclusions that can be drawn from a study.
Experimental Research Design
Researchers manipulate an independent variable and use random assignment.
Goal: Establish cause-and-effect relationships.
Example:
Comparing the effectiveness of two psychotherapy interventions.
Quasi-Experimental Design
The researcher manipulates a variable but cannot randomly assign participants.
Example:
Comparing outcomes between naturally existing groups.
Non-Experimental (Correlational) Design
Researchers observe variables without manipulating them.
Example:
Examining the relationship between stress and sleep quality.
Important: Correlation does not imply causation.
Don’t Fear Sigma (Σ): Introduction to Summation Notation
One symbol that often intimidates students is the Greek letter Sigma (Σ).
Fortunately, its meaning is simple:
Σ = Sum of
Suppose four grapes weigh:
- 2 grams
- 3 grams
- 4 grams
- 5 grams
Then:
ΣX = 2 + 3 + 4 + 5 = 14
Summation notation provides a compact way to represent calculations involving large datasets.
As you progress in statistics, you’ll encounter concepts such as:
- Squared sums (ΣX²)
- Sum of products (ΣXY)
- Mean
- Variance
- Standard deviation
- Correlation
Mastering Sigma early will make advanced statistical topics much easier to understand.
Common Mistakes Psychology Students Make
Many psychology students try to memorize statistical formulas without understanding the underlying concepts. This often leads to confusion, frustration, and exam anxiety.
Instead, focus on understanding:
- What the data represents
- Why a particular statistical procedure is used
- When a specific method should be applied
- How research questions influence statistical choices
When the logic becomes clear, the formulas become significantly easier to remember and apply.
Final Thoughts
Statistics is not the enemy of psychology—it is one of its strongest allies.
Every psychological theory, assessment tool, treatment approach, and research finding gains credibility through statistical analysis. By understanding concepts such as variables, scales of measurement, sampling, research design, and summation notation, you create a strong foundation for future learning.
Remember: Statistics is not about becoming a mathematician. It is about learning how to think scientifically and interpret human behavior through evidence.
The sooner you become comfortable with statistics, the more confident you will feel as a psychology student, researcher, and future mental health professional.
Continue Learning with Mind Review
If this blog helped you understand psychological statistics, there is much more waiting for you.
📚 Study Resources
- Download my handwritten notes on Psychological Statistics.
- Explore additional blogs covering psychopathology, psychological assessments, psychotherapy, research methods, and clinical psychology.
- Listen to psychology-focused podcasts available through Mind Review.
🎥 Prefer learning through videos?
Mind Review is dedicated to simplifying psychology for students and mental health professionals. You can also explore psychology lectures, research methods, psychological statistics, assessment techniques, and clinical psychology content on the Mind Review YouTube Channel.
Stay Connected with Mind Review
If you found this article helpful, explore more psychology content through Mind Review.
📺 Subscribe to the Mind Review YouTube Channel for psychology lectures, exam preparation tips, research methods, psychological statistics, and clinical psychology content.
📖 Visit www.mindreview.in for detailed psychology blogs, study notes, and educational resources.
📱 Follow Mind Review on social media for regular psychology updates and learning resources.
Research • Understand • Heal